
How to view inventory reports in Snad
To view stock in Snad ERP, open Reports, then Current stock in the Inventory card. The table shows each product's quantity, cost and total. Narrow it with the Warehouse or Product filter, then export or print from More.
In this guide6
Steps
Step 1: Open the current stock report
In the sidebar choose Reports, then press Current stock in the Inventory card. Details
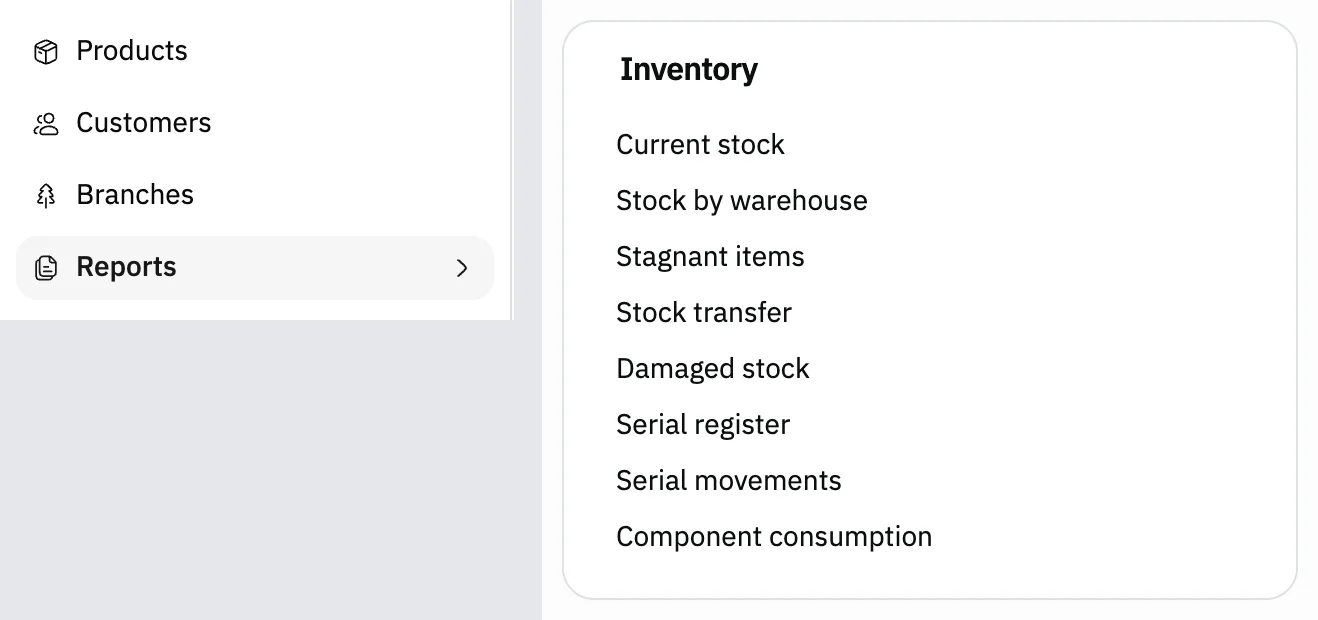
Image key - Reports in the sidebar
- Current stock
Step 2: Read the stock table
Each product shows its Name, Product number, Quantity and Cost. Quantity adds up every warehouse, and Total is quantity times cost. Details
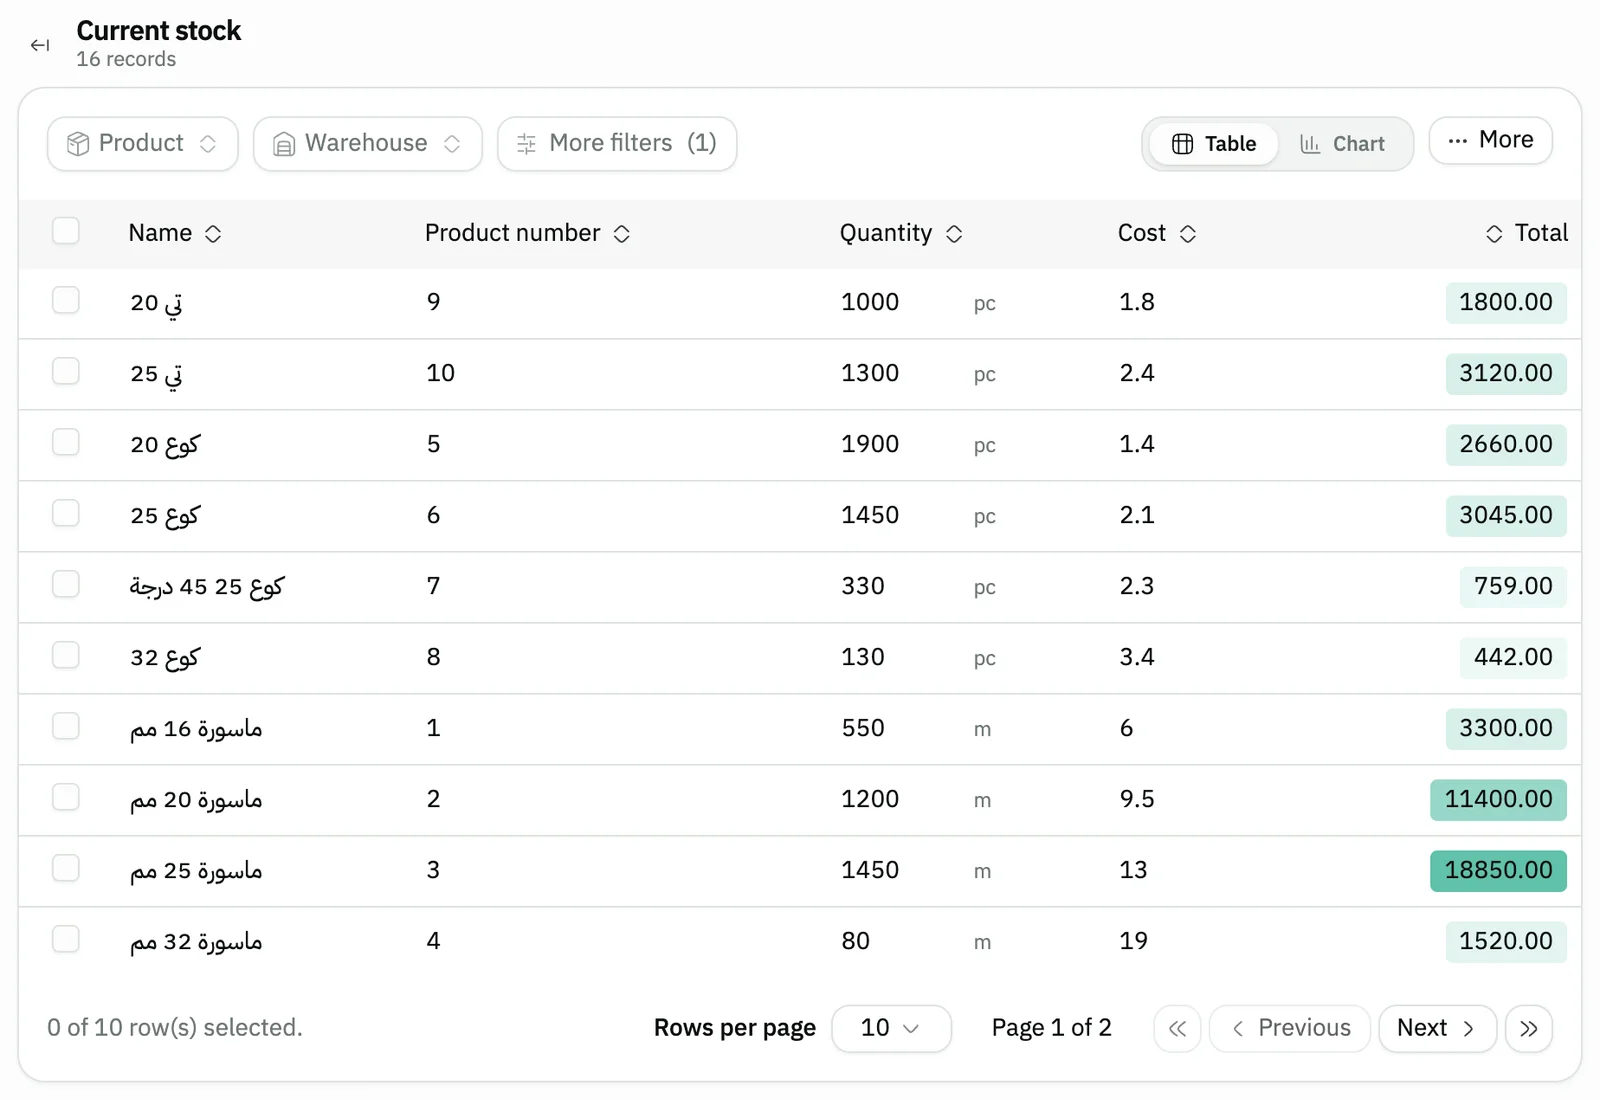
Image key - Number of records
- Quantity
- Cost
- Total
Step 3: Pick the warehouse
Press Warehouse, tick one or more warehouses, then press Apply. Quantity then counts only the chosen warehouses (warehouses). Details
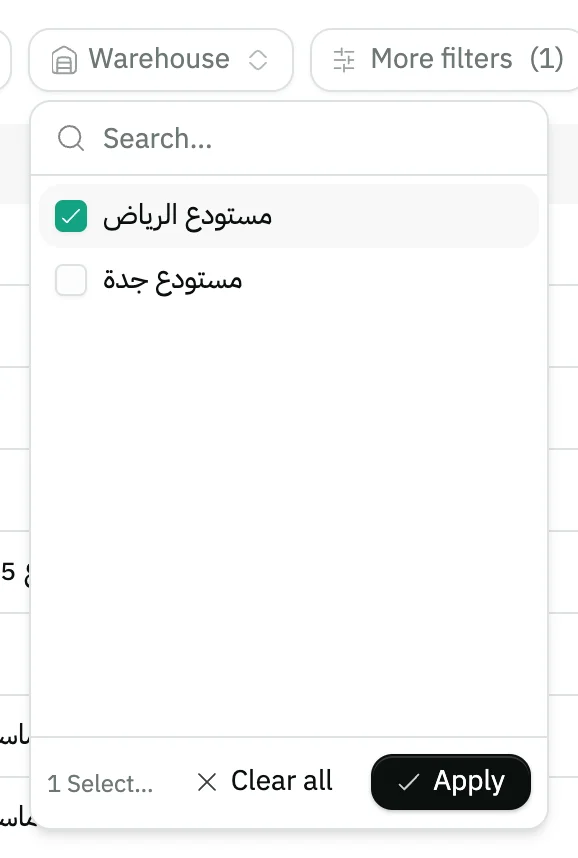
Image key - The Warehouse filter
- The ticked warehouse
- The Apply button
Step 4: Open a product's details
Click any row and a window opens with the product's quantity and cost in each warehouse. The up and down arrow keys move between products.
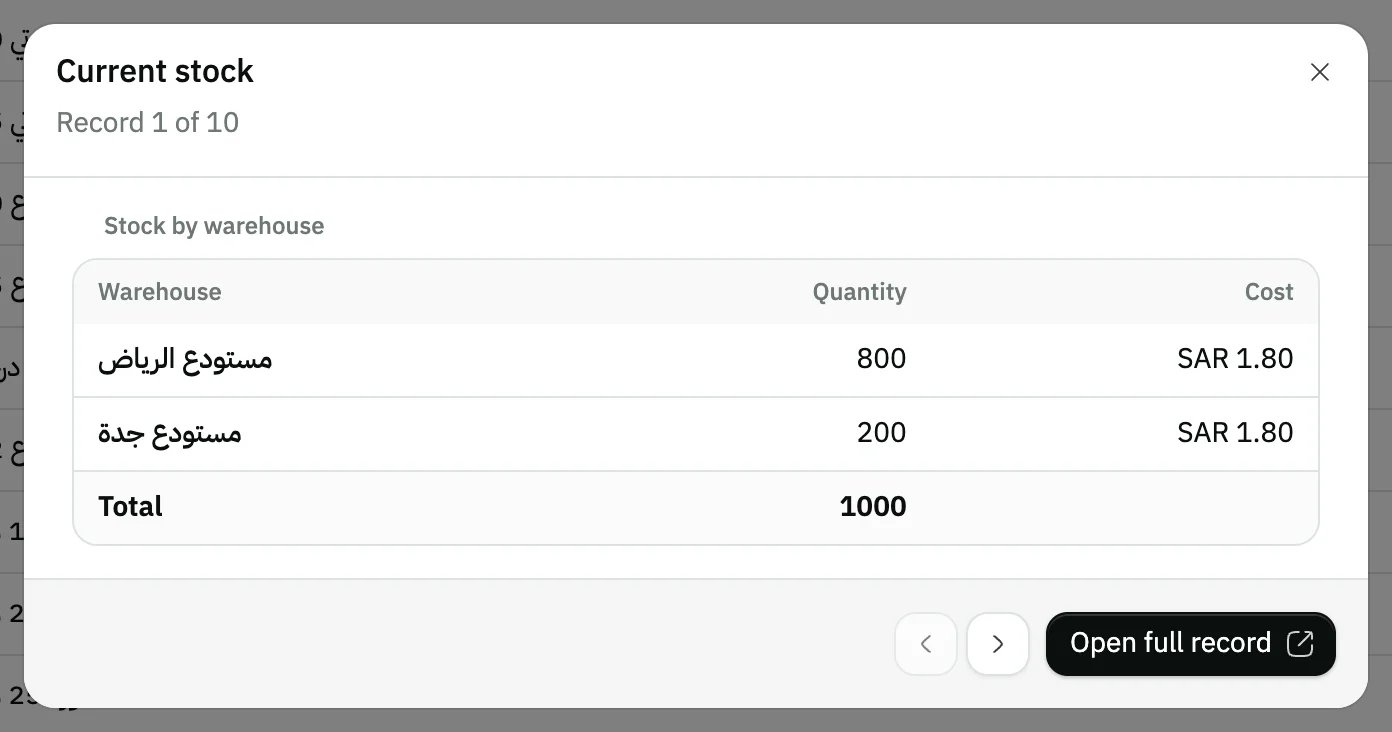
Image key - The warehouses, with the product's quantity and cost in each
- The Open full record button
Step 5: See stock as a chart
Press Chart above the table to see the numbers as bars, and Table to go back. Alt + V switches between them. Details
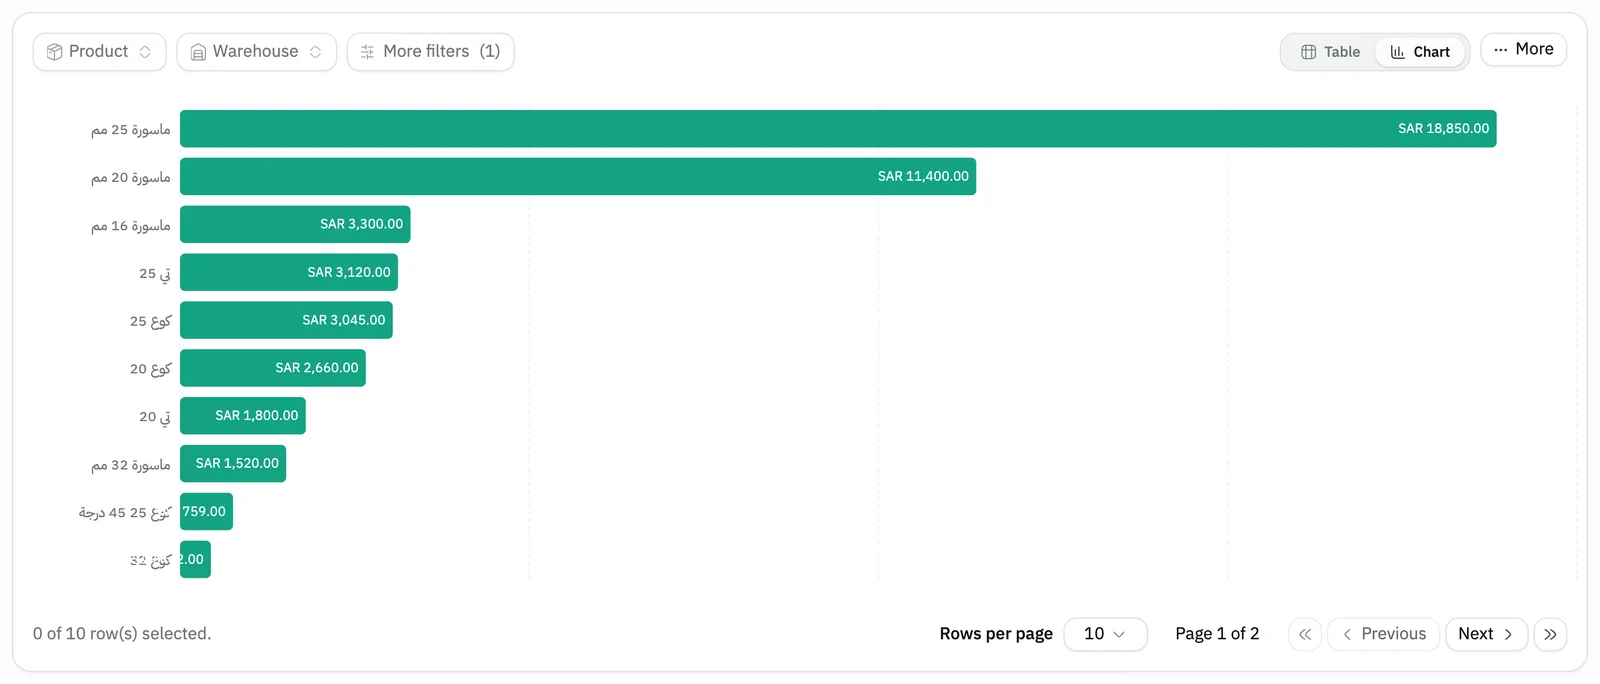
Image key - Table and Chart
Step 6: Export or print the report
Press More, then choose Export as Excel or CSV, or Print. The file carries the rows shown after your filters.
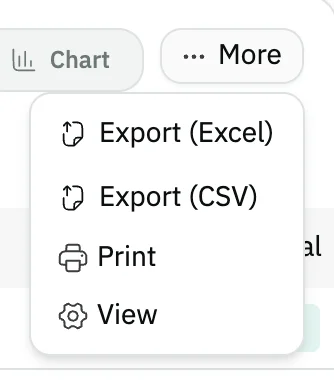
Image key - The More button
- Export Excel, with CSV below it
Messages that block saving
If saving fails, one of these messages shows next to the field. The table gives the cause and the fix.
| Message | Cause | Fix |
|---|
Advanced details
Each section here explains one point from the steps in depth. Every section has a fixed link you can share.
Filter by product, category, brand, product type and stock status
The Product filter narrows the table to one or more products. Press it, search by name, tick what you need, then press Apply.
The Category and Brand filters narrow the table the same way. They also work in Stock by warehouse, Stagnant items, Serial register, Serial movements and Component consumption.
Under More filters you find Product type, to see one kind of product only. Reset filters returns the table to how it started.
The Stock status filter takes one choice: Out of stock, for products whose quantity in the row is zero or less, or Running low, for products whose quantity is above zero and at or below the product's reorder level. A product with no reorder level never appears under the second choice. The quantity compared is the one shown in the row, that is, its total over the warehouses the report covers according to the Warehouse filter.
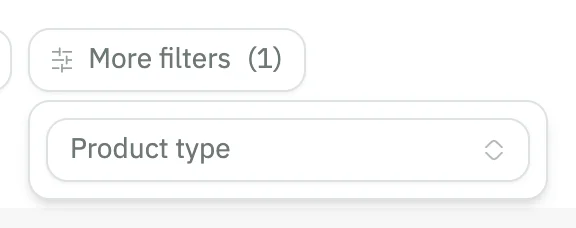
- The More filters button
- Product type
Why is a product missing from the report?
Inventory reports leave out services, the parent product that variants branch from, and derived items, which draw on their base product.
And if you pick a Warehouse, only products with a record in that warehouse show.
A parent product with two or more variants shows as a heading line above its variants instead of a quantity row, so its quantities are in its variants' rows (variants in the report).
A product with no quantity yet? Import quantities or record them with a stock adjustment.
Products with variants in the report
In Current stock and Stock by warehouse, each parent product with two or more variants shows a heading line with its name and item count, and under it one row per variant with its quantity, cost and total. A parent with a single variant shows that variant as a normal row with no heading.
The pager counts a parent and its variants as one unit, so a page can hold more rows than its page size. Paging never splits one product's variants across two pages.
The Stock status filter still works on each variant by itself, so a parent's heading shows while at least one of its variants matches.
In Stock by warehouse, the items card counts variant rows across the whole result, not the number of parent products.
Export and print are unchanged: one line per variant, without the heading lines.
The other reports in the Inventory card
Stock by warehouse asks you to pick one warehouse first, then lists its products, with the item count, and the total quantity and value of the rows on screen, above them.
Stagnant items are products with stock that have not sold within a period. The period starts at 90 days and you change it in the Stagnant period (days) filter. It shows Days since last sale and Last sale date, and Never sold for products that never sold.
Stock transfer and Damaged stock list what was recorded; you record them with stock transfers and damaged stock.
The same card also holds the Serial register, Serial movements and Component consumption reports.
Keyboard shortcuts
Open any report without going through the reports page (keyboard shortcuts):
- The command palette, Ctrl + K (⌘ + K on Mac): type the report name, such as “Current stock”.
- Alt + V in any report: switch between table and chart.
Can't see Reports or the Inventory card?
The reports page shows to users allowed to view reports, and each card needs the permission of its section. So the Inventory card needs permission to view inventory reports (roles and permissions).
If your user is tied to a branch or warehouse, you only see the figures of your warehouses (data access).
Common questions
- How do I see a product's quantity in each warehouse?
- Open Current stock and click the product's row. The window shows its quantity and cost in each warehouse.
- How do I find the value of my stock?
- The Total column is each product's value: quantity times cost. If your prices include tax, it is called Total (incl. tax). For one warehouse, open Stock by warehouse and pick it.
- How do I export the stock report to Excel?
- Press More above the table, then Export as Excel. The rows shown after your filters are exported.
- How do I find products that don't sell?
- Open Stagnant items. It lists products that have stock and haven't sold within the period you set, starting at 90 days. For product sales, see sales reports.
- Can I see my stock as a chart?
- Yes. Press Chart above the table, or Alt + V, and the numbers show as bars.