
How to read the dashboard in Snad
To read the dashboard in Snad: press Ctrl + K and choose Dashboard. Pick the period from Select period and the branch from Branch, then read the KPI cards at the top. Below them are the sales chart, product lists and alerts, and Quick navigation starts an invoice or a product.
In this guide6
Steps
Step 1: Open the dashboard
Press Ctrl + K on the home page or an AI Mode page, type dashboard, and choose Dashboard. Learn when the quick search is available.
Step 2: Choose the period and branch
At the top, open Select period and pick today, week or month. Then use Branch to narrow to one branch, or leave all. Details

Image key - The Select period list
- The Branch list (shown with two or more branches)
- The Refresh button
- The Export PDF button
Step 3: Read the KPI cards
Each card shows its name, the chosen period and a count under the figure. They include Net sales, Purchases and POS sales. Details

Image key - The Net sales card, with the period beside its name
- The Purchases card
- The POS sales card
Step 4: Start from quick navigation
Under the header, Quick navigation holds the actions you use most, such as New sales invoice. The rest sit under More.

Image key - The Quick navigation bar heading
- The first action in the bar
Step 5: Follow the chart and lists
Sales details charts the last 15 days, with Top products beside it. Then Recent activity and Inventory alerts. Details
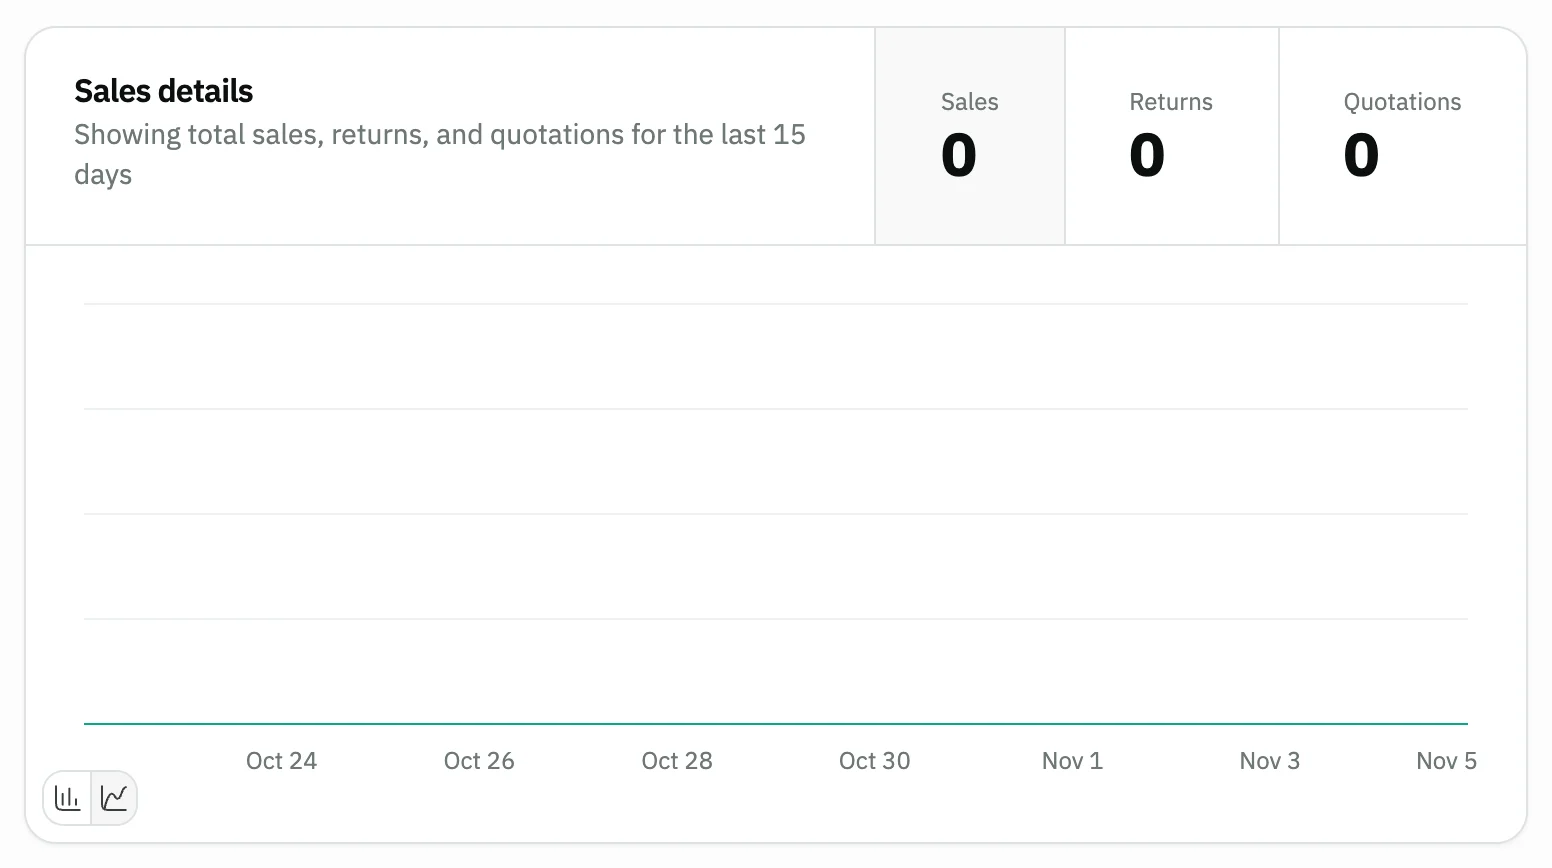
Image key - The Sales details chart
Step 6: Refresh or export the numbers
Press Refresh or Alt + R to reload the figures, and the last-updated time changes. Export PDF or Alt + X opens printing. Details
Messages that block saving
If saving fails, one of these messages shows next to the field. The table gives the cause and the fix.
| Message | Cause | Fix |
|---|
Advanced details
Each section here explains one point from the steps in depth. Every section has a fixed link you can share.
Branch and organization-wide figures
The Branch list shows only when your organization has two or more branches you are allowed to see. Changing the branch refreshes the whole dashboard.
Choose All branches to return to the combined figures. Some cards stay organization-wide and ignore the branch, and a badge beside them says so.
Why the dashboard differs between users
Every card and list shows according to the role. A user without purchase access doesn't see the Purchases card, and without sales access doesn't see the sales chart.
The same goes for On leave today (HR), POS today (POS) and Bookings (the Bookings app). Change access in roles and permissions.
The sales chart: three tabs
Switch between Sales, Returns and Quotations above the chart. The window is fixed at the last 15 days, so the period list doesn't change it.
For details and date filters, open the sales reports.
Export and shortcuts
Export PDF prints the dashboard through your browser, so choose save as PDF in the print window.
Press Shift + / to list every shortcut on the page. Details are in keyboard shortcuts.
Common questions
- Where is the dashboard in Snad?
- It isn't in the sidebar. Press Ctrl + K and choose Dashboard, or open /dashboard/overview directly.
- Why doesn't the sales chart change with the period?
- The period list only drives the KPI cards. The Sales details chart always shows the last 15 days.
- Why can't I see the purchases or POS card?
- Visibility follows your role. Ask your administrator to grant the purchases or POS dashboard access in roles and permissions.
- How do I see just one branch?
- Open the Branch list beside the period list and pick the branch. If it isn't there, your organization has one branch or your role allows no other; you can add a branch.