
How to view the income statement in Snad
To view the income statement in Snad ERP, open Reports, then Income statement in the Accounting card. It starts with revenue and ends with net profit and its margins, with accounts under each section. Change the period or branch, switch between Summary and Monthly, then export or print.
In this guide8
Steps
Step 1: Open the income statement
In the sidebar choose Reports, then press Income statement in the Accounting card. Details
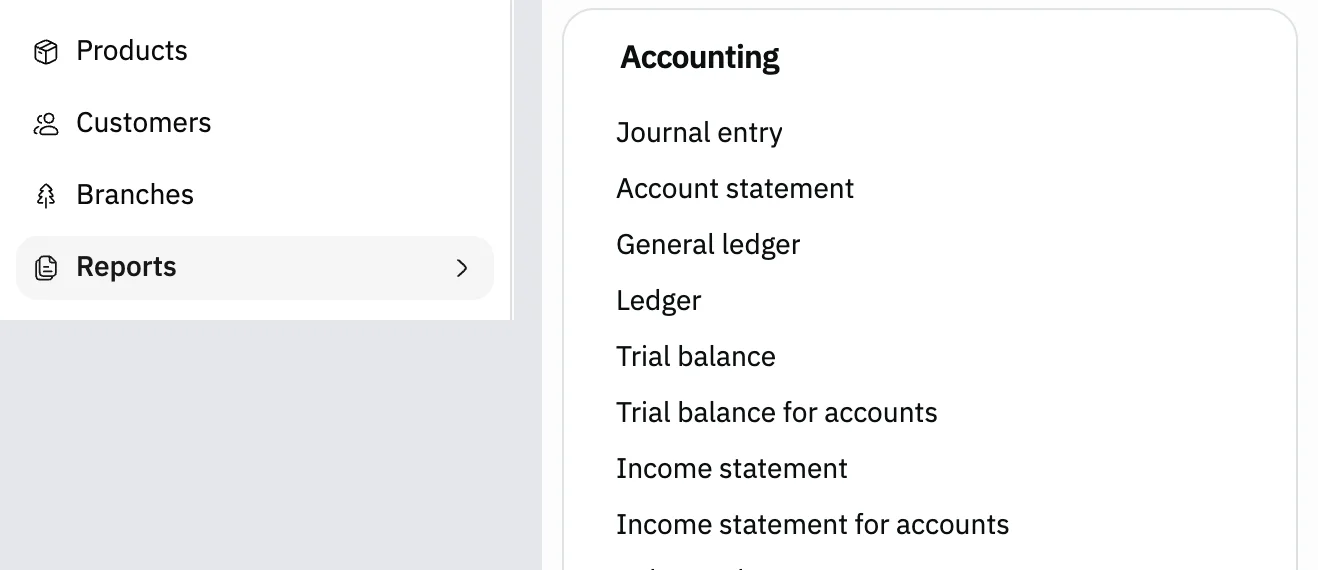
Image key - Reports in the sidebar
- Income statement
Step 2: Read the statement sections
The statement starts with the “Revenue” section, then “Cost of Sales (COGS)” and “Operating Expenses”. Each section lists its accounts and ends with its total. Details

Image key - The section name: “Revenue”
- An account and its figure in the Balance column
- The total line: “Total Revenue”
Step 3: Read the profit and margins
“Gross Profit” is revenue minus cost of sales, and the last lines are “Net Profit / (Loss)”. Under each profit sits its margin as a share of revenue. Details
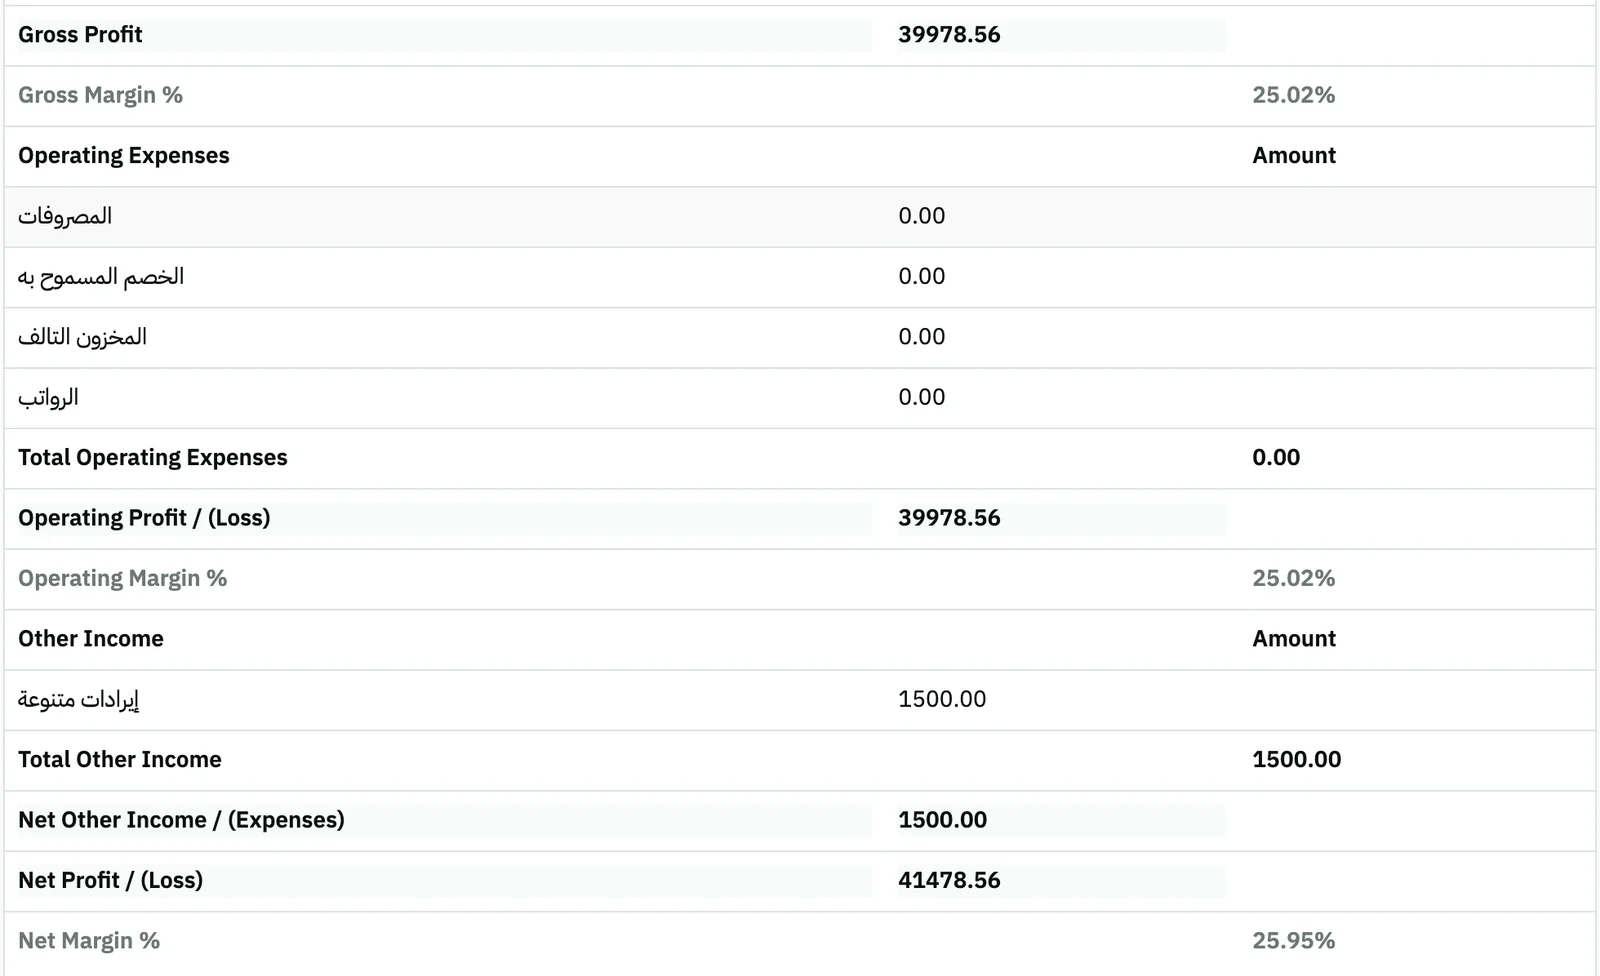
Image key - The “Gross Profit” line
- The “Net Profit / (Loss)” line
- The net margin in percent
Step 4: Change the period
The statement opens on your financial period. Press the date picker and choose This month, Last year or any range, and the figures update. Details
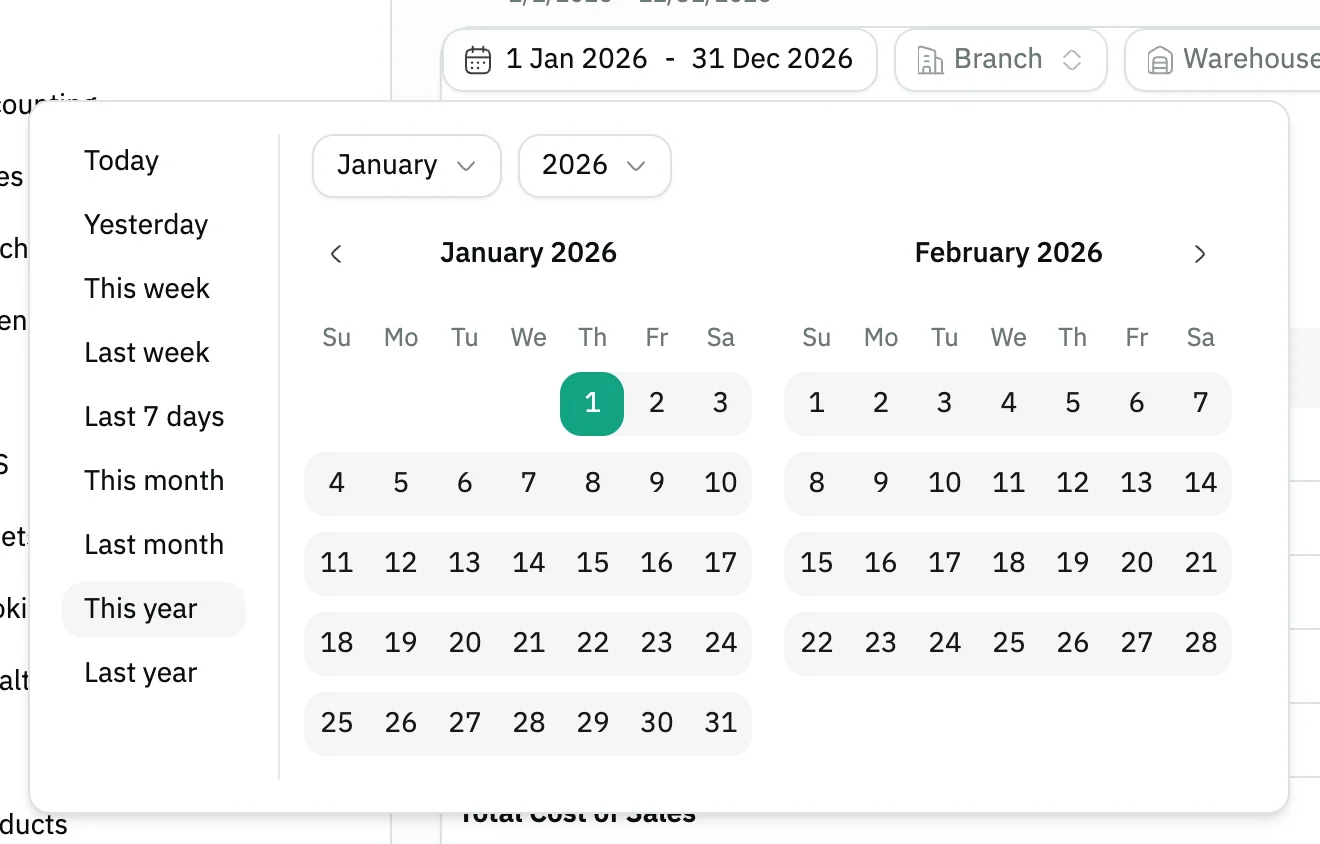
Image key - The period picker
- Ready-made periods: This month, Last year and others
Step 5: Pick a branch or warehouse
To see one branch's profit, press Branch, tick it, then press Apply. Warehouse works the same way (branches and warehouses). Details
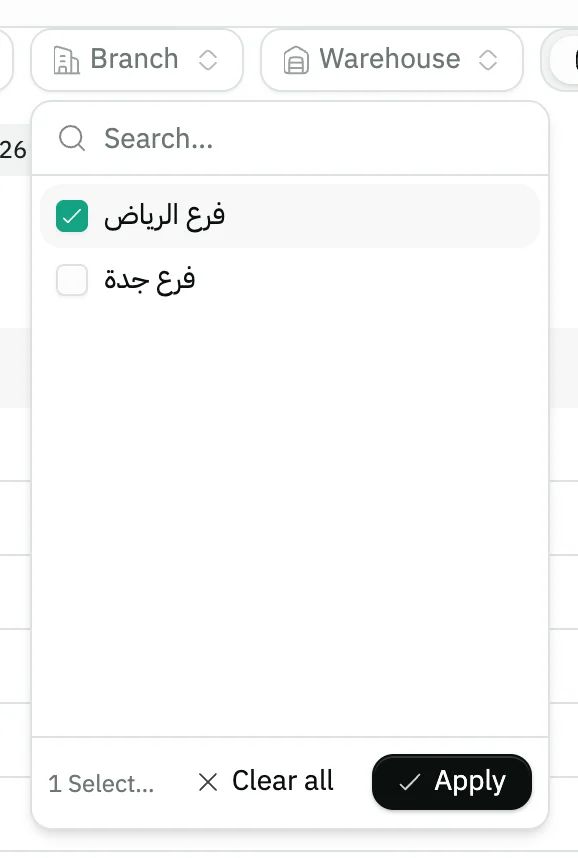
Image key - The Branch filter
- The ticked branch
- The Apply button
Step 6: Compare month by month
Switch from Summary to Monthly. You get one column per month in the period. Scroll the table sideways to reach the Total column for all of it. Details
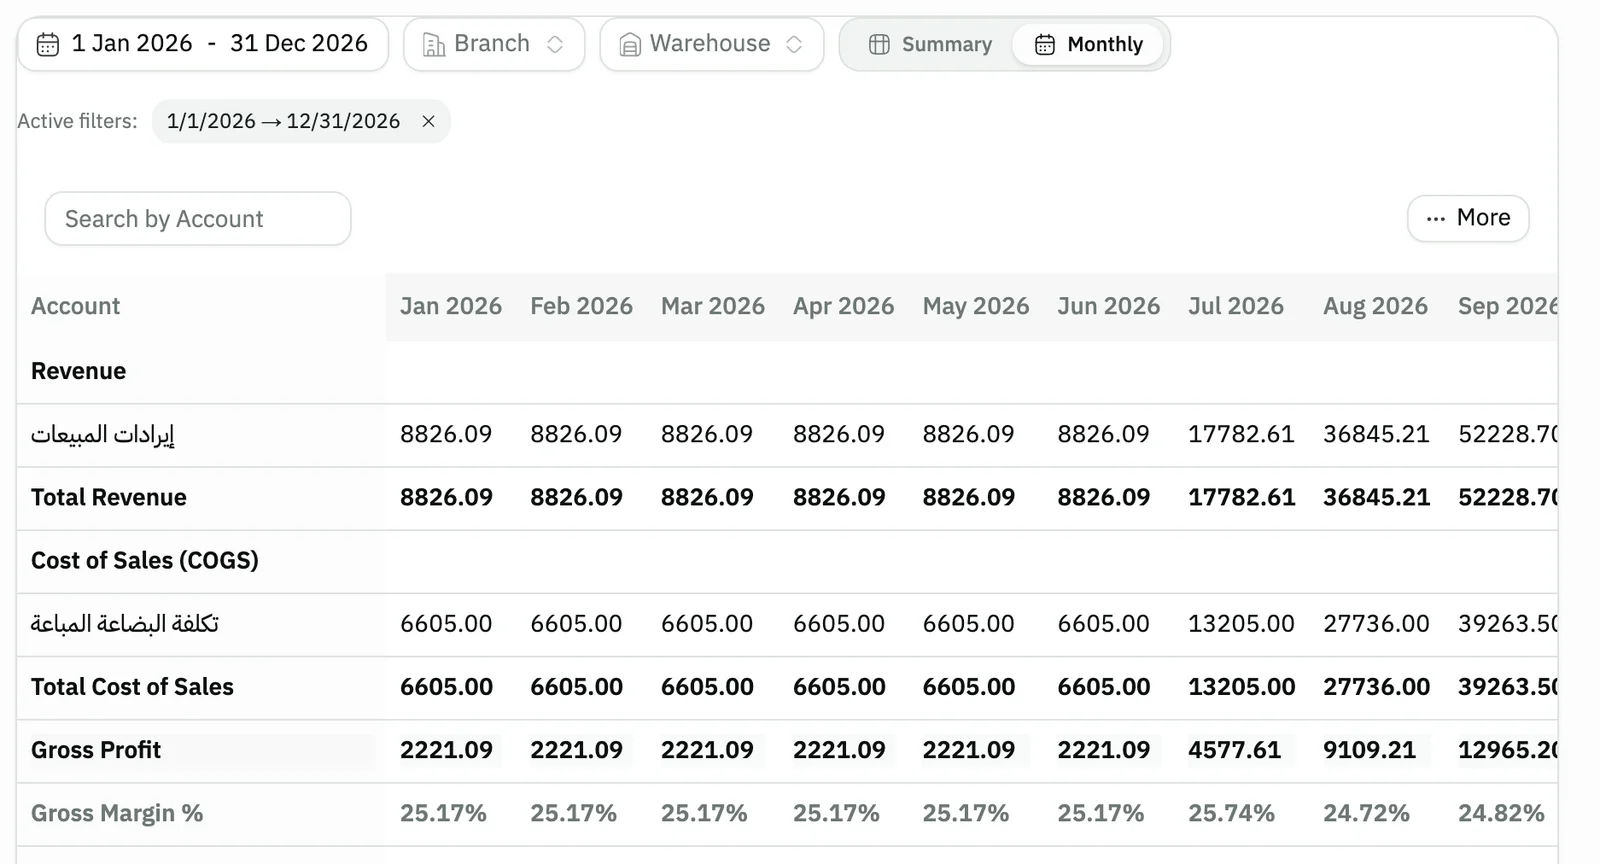
Image key - The switch between Summary and Monthly
- A month column
Step 7: Open an account's sub-accounts
Go back to Summary and click any account. A window opens with its sub-accounts that had activity in the period, with Debit, Credit and Balance.
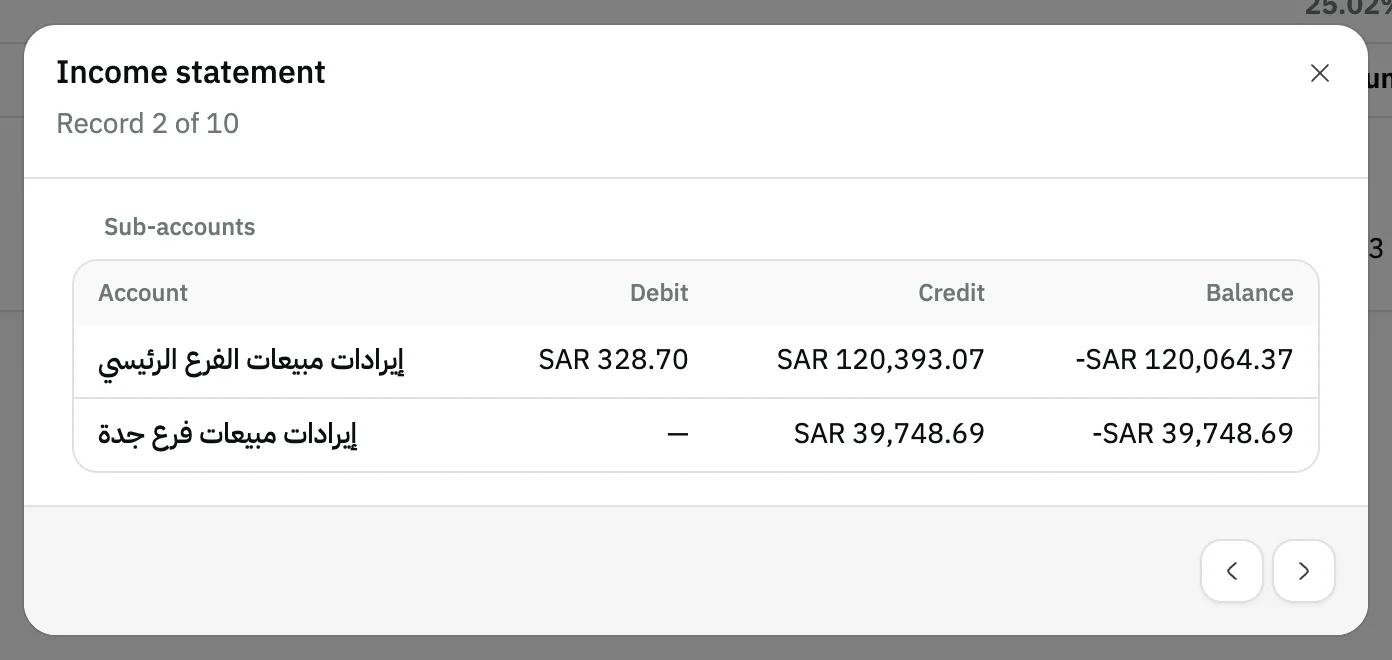
Image key - The sub-accounts and their figures
Step 8: Export or print it
Press More, then Export as Excel or CSV, or Print. The statement comes out for the period you chose.
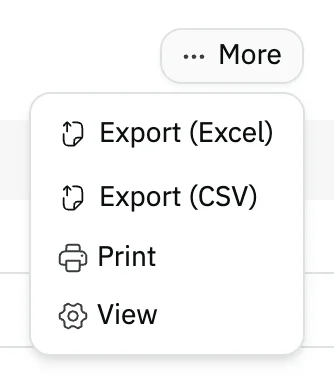
Image key - The More button
- Export Excel, with CSV below it
Messages that block saving
If saving fails, one of these messages shows next to the field. The table gives the cause and the fix.
| Message | Cause | Fix |
|---|
Advanced details
Each section here explains one point from the steps in depth. Every section has a fixed link you can share.
How accounts are filed under sections
The statement holds revenue and expense accounts only. Snad decides each account's section from the accounts linked in your settings, then from its Budget group, then from its parent account.
To move an account to another section, change its Budget group in the account details or in the accounting settings.
A section with no accounts is left out, together with the profit line it feeds. With no cost of sales there is no “Gross Profit” line.
How the figures are worked out
Revenue and expenses are both shown as positive figures. “Gross Profit” = revenue − cost of sales, and “Net Profit / (Loss)” = operating profit + other income − other expenses.
Every margin is measured against total revenue. If the period has no revenue, a dash shows instead of a percentage.
A figure goes negative when refunds exceed sales, or when an expense was refunded. A profit line that turns into a loss is shown in red.
A branch or warehouse changes the sums
When you pick a Branch or Warehouse, only that branch's or warehouse's movements are added up. Operations not tied to it are left out.
The period and branch you picked stay the same when you move between Summary and Monthly.
The default period
The statement opens on your organization's current financial period. You set it in the financial period.
Limits of the monthly view
Monthly covers up to 12 months. If you pick a longer period, Snad refuses it and sends you back to Summary, so narrow the period.
Months are counted in your organization's time zone, and the months add up to the Summary figure for the same period.
The income statement for accounts
The link below Income statement in the Accounting card is Income statement for accounts. It lists the sub-accounts themselves, row by row, with the same sections, period and branch.
For what to read next: the trial balance, the balance sheet and an account statement.
Can't see the Accounting card?
The Accounting card shows to users allowed to view accounting reports (roles and permissions).
If your user is tied to a branch or warehouse, you only see the figures of your own scope (data access).
Common questions
- Where do I find net profit in Snad?
- Open the Income statement. The “Net Profit / (Loss)” line is at the end, with its margin as a share of revenue below it.
- How do I see the income statement for one month?
- Press the date picker and choose This month or Last month, or pick any range on the calendar.
- How do I compare profit month by month?
- Switch from Summary to Monthly. You get a column for each month, up to 12, and a Total column.
- Why is there no gross profit line?
- Because the “Cost of Sales (COGS)” section has no accounts on the statement, so it is left out along with the profit line it feeds.
- How do I see one branch's profit?
- Press Branch, tick the branch, then press Apply. The figures update for that branch alone.